Introduction
So in my quest for alpha, I've found statistical arbitrage to be the most interesting and fun (and intuitive) class of trading strategy so far. In previous posts, I've experimented with different iterations of pretty much the same concept where I trade the spread between two different things using a Z-score threshold. That's shown some promise, but I'd like to try some new things to improve the quality of my signals. During this post, I'll do two main things:
1. Try different ways to improve upon the basic pairs trading strategy.
2. Attempt to backtest and validate the performance of my refined signal using various techniques.
Classic Pairs Trading
The classic pairs trading strategy is built on the idea that two assets share a long-term equilibrium relationship. When the spread between them drifts too far from this mean, it eventually snaps back. The goal is to trade that spread.
The first step is to define the spread. I do this using OLS regression
where: - and are the price series of the two assets, - is the hedge ratio, - is the spread we're going to trade.
Once we have the spread, we compute its Z-score:
where and are the historical mean and standard deviation of the spread over some lookback window. We then long the spread when , short it when , and close the trade when it mean-reverts.
This is simple, intuitive, and easy to implement. But there are weaknesses. Most importantly, it's pretty rigid. You're using fixed thresholds and static estimates for something that might be shifting over time.
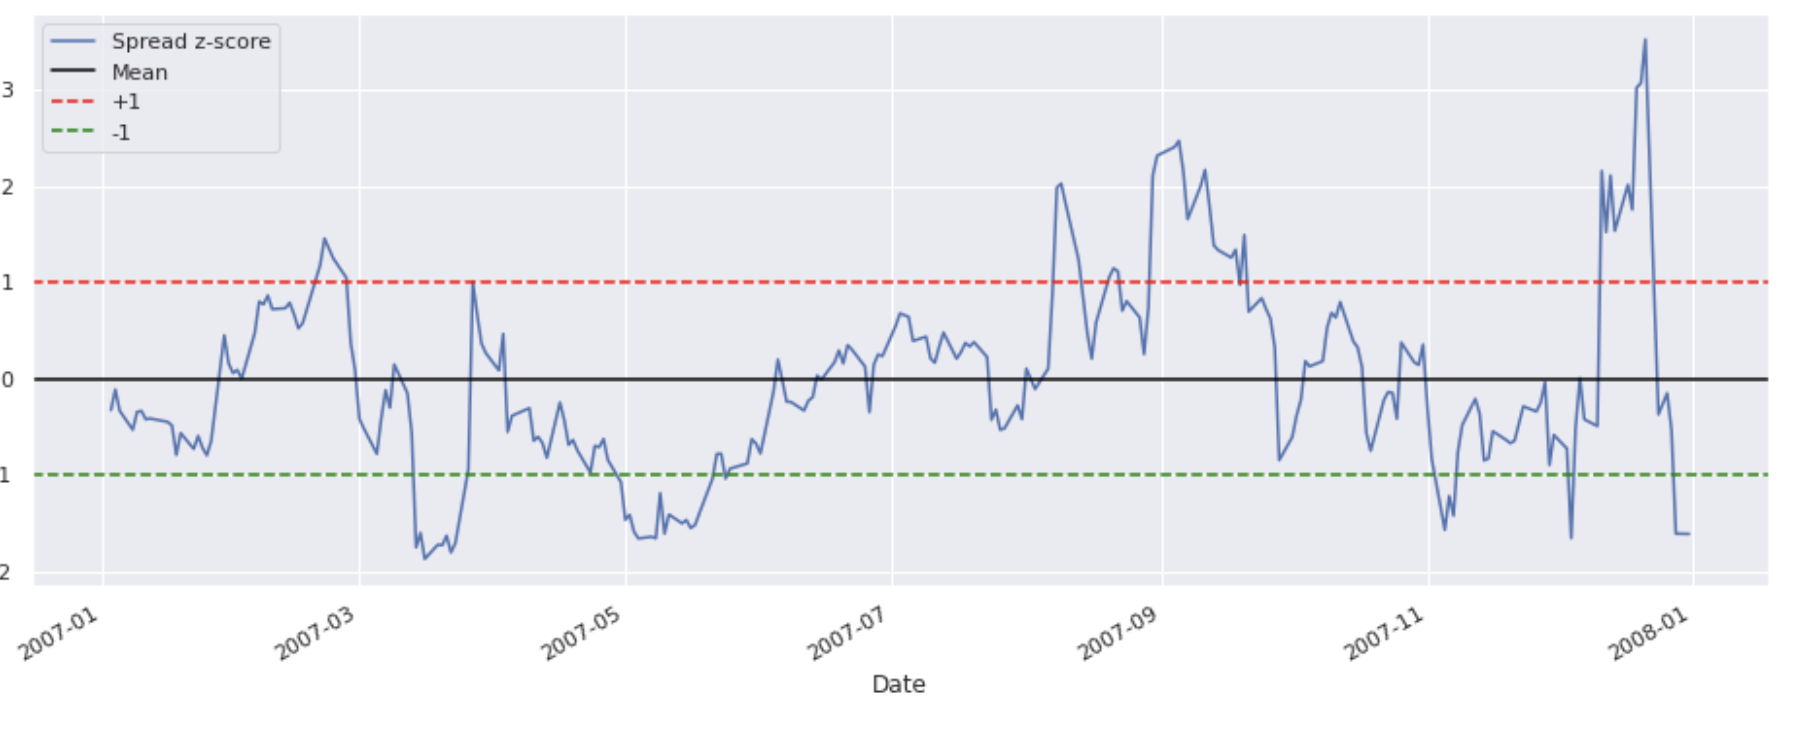
Below is a picture of this mean reverting spread. When it goes below the lower band we long the spread, and when it goes above the upper band we short the spread. Simple enough, right?
1. Rolling Mean
A small but meaningful improvement over the classic approach is to replace the static mean and standard deviation with rolling ones. That is, at each time step, we recompute the mean and standard deviation over the last bars, so the Z-score becomes:
This makes the signal adaptive. If volatility spikes or the spread drifts over time, the thresholds adjust accordingly. The trade-off is that this method becomes more sensitive to noise. If the window is too short, the bands can overreact to recent outliers, triggering false signals. But if tuned properly, rolling stats can give a more realistic view of what “normal” looks like in the current regime.
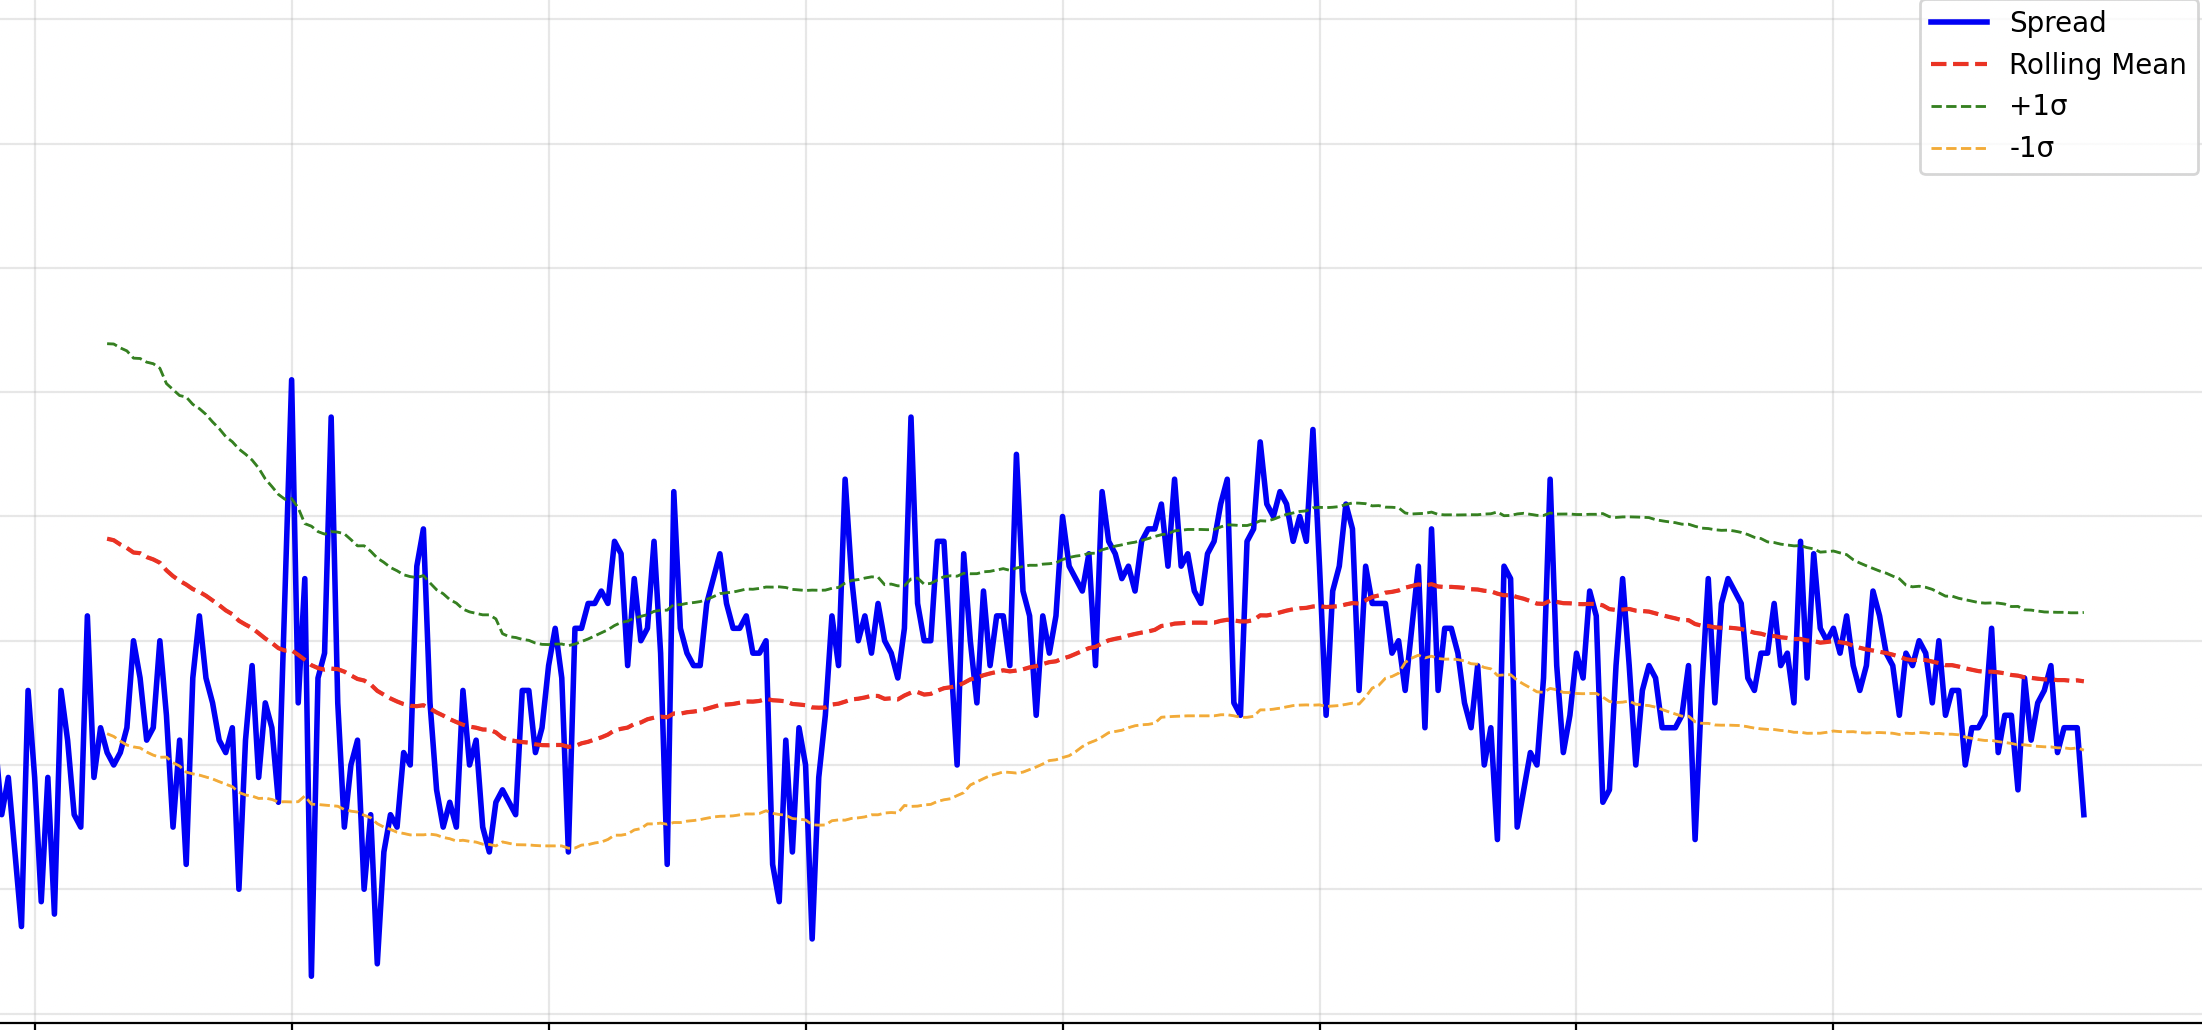
Below is a picture of what I'm talking about. Compare to the last picture. See how the threshold is dynamic?
2. Kalman Filter
The Kalman filter takes things a step further. Instead of just reacting to recent data like a rolling average, it builds a probabilistic model of the spread. At every time step, it updates its belief about the "true" state of the spread based on both its prediction and the new observation.
I've seen some people call this the rich man's moving average. It learns how much to trust new data versus its prior belief. If the market is noisy, it leans more on its internal model. If something big changes, it reacts faster.
In this context the Kalman filter can be used to estimate: - The latent spread (like a dynamic mean) - A time-varying hedge ratio (dynamic beta) - Or both, using a state-space representation
One common use case is to model the spread as:
and let evolve over time, adapting to changing market dynamics. You trade when the actual spread diverges significantly from the Kalman estimated mean. This helps reduce whipsaws and makes the strategy more robust in changing environments.
3. OU Process
The Ornstein-Uhlenbeck (OU) process is a continuous-time stochastic model that explicitly captures mean-reverting behavior. It can be used as a theoretical foundation for spreads that look stationary.
The OU process is defined by this SDE:
where: - is the current value of the spread, - is the long-run mean, - is the speed of reversion, - is the volatility, - is a Wiener process (Brownian motion).
Once we fit the OU model to historical spread data, we can use its parameters to simulate forward returns, compute half-life, or create probabilistic thresholds for trade signals.
One nice thing about the OU process is that it provides a way to quantify how strong or fast the mean reversion is. The higher the value of , the faster the spread snaps back to its mean. That helps when deciding how aggressively to size positions or how long to hold trades.
It also gives us a way to move beyond fixed z-score thresholds. Instead of saying “buy at Z = -1,” we can use model-implied probabilities to way more dynamic trading logic.
Comments
Log in to leave a comment.
No comments yet.