Spot Futures Arbitrage: A gold mine!!!!!
Table of Contents
- Introduction and Strategy Overview
- Futures Pricing Model
- Data Collection
- Modeling the Spread with Threshold Vector Error Correction (TVECM)
- Backtesting and Live Trading
1. Introduction and Strategy Overview
In this strategy, I trade the spread between the spot price of gold (XAU/USD) and the front-month gold futures contract traded on the COMEX exchange. The theoretical futures price is derived from the cost-of-carry model, and deviations between the market price and the theoretical price represent potential arbitrage opportunities.
According to the cost of carry model, this spread should be mean reverting, so we trade it!!
1.1 Why Gold?
- Gold is highly liquid with deep futures and spot markets.
- CME gold futures (GC) are standardized and heavily traded.
- XAU/USD is widely quoted by brokers and OTC providers.
1.2 Strategy Setup
We define the spread at time as:
Where:
- : Observed futures price
- : Theoretical futures price calculated from spot and interest rate data
We monitor this spread over time to detect pricing changes.
1.3 Selecting a time to expiry
At any given time, there are a lot futures contracts to choose from, but according to my analysis it seems that the front month is the most liquid, followed by the one after that, and so on. Here is a graph showing the number of trades in a given day for all gold futures contracts available at that time.
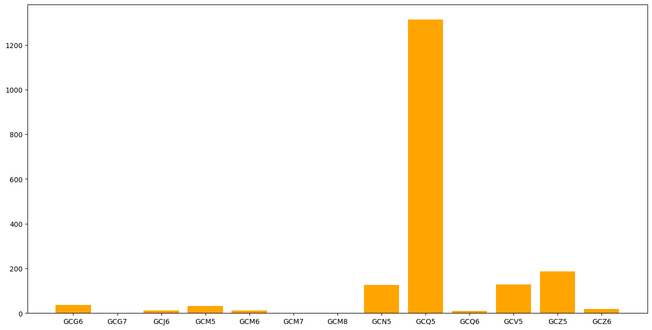
You can see that the front month (GCQ5) is by far the most traded. This is what we will be using.
Since I'm trading the front month future, I just used the 1 month risk-free rate. (Is that right?)
2. Futures Pricing Model
To determine whether the gold futures market is mispriced relative to spot, we calculate the theo using the cost-of-carry model.
Cost of Carry Formula
The theoretical price of a futures contract is given by:
Where:
- : Theoretical futures price at time
- : Spot price of gold (XAU/USD) at time
- : Annualized risk-free interest rate at time
- : Time to expiration (in years) between and the futures contract's expiration date
(No storage costs are assumed here)
Expiry Date Inference
Gold futures contracts on COMEX expire on the third last business day of the month preceding delivery. For example:
- GCQ5 (August 2015 contract) expires on July 29, 2015
- GCU5 (September 2015) expires on August 27, 2015
Given a timestamp and a futures symbol (e.g., GCQ5), I have a function to infer the expiry date to calculate precisely.
Risk-Free Rate Data
I then take the daily RFR data and align it to our tick-level futures and spot data.
Final Theoretical Spread
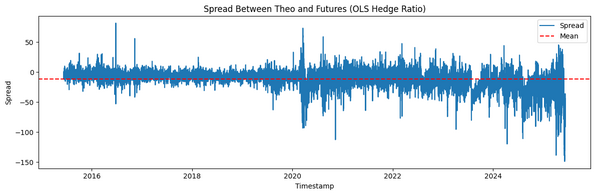
Once we have all components, we compute the spread:
This spread becomes our primary signal for potential arbitrage.
Here is a plot showing the stationarity of this spread:
3. Data Collection
I got my futures data from Databento and my spot data from this website:
https://www.histdata.com/download-free-forex-historical-data/?/metatrader/1-minute-bar-quotes/XAUUSD
I tried AlphaVantage and some other data sources for spot data but they either provided BS data or didn't go as far back as I needed (2015).
4. Modeling the Spread with Threshold Vector Error Correction (TVECM)
To identify mean reverting behavior and regime dependent arbitrage signals, we model the spread using a Threshold Vector Error Correction Model (TVECM)!!!!
4.1. Motivation
Traditional linear models (e.g., VECM) assume that the spread mean-reverts symmetrically, but in practice:
- Small deviations from the theoretical price may not be arbitraged due to transaction costs.
- Large deviations can trigger stronger correction forces.
This justifies a threshold model—a nonlinear system where correction only activates beyond a certain band.
4.2. TVECM Specification
Let be a 2-dimensional vector of observed and theoretical futures prices. The TVECM is written as:
Where:
- is the error correction term (typically the spread)
- is the threshold estimated from data
- encode cointegration in each regime
- are short-run dynamics
- are white noise residuals
4.3. Interpretation
- When the spread is within the threshold band, market frictions dominate and no adjustment occurs.
- Outside the threshold, arbitrage forces activate, and the spread mean-reverts toward equilibrium.
- This regime-switching dynamic improves trading signal quality by filtering out noise.
5. Backtesting and live trading.
I cannot live trade this strategy because I'm having trouble finding ways to short spot gold directly. I can find securities with short exposure to gold but they are subject to their own pricing inefficiencies that this model doesn't account for.
I will have a section for backtesting soon.
Comments
Log in to leave a comment.
No comments yet.